
The United States is the top destination in the world for people moving from one country to another. Over 70 million immigrants have arrived in the U.S. since 1965, according to a Pew Research Center analysis of Census Bureau data. About 18 million have come from Mexico, making up the largest wave of immigration from a single country to the U.S.
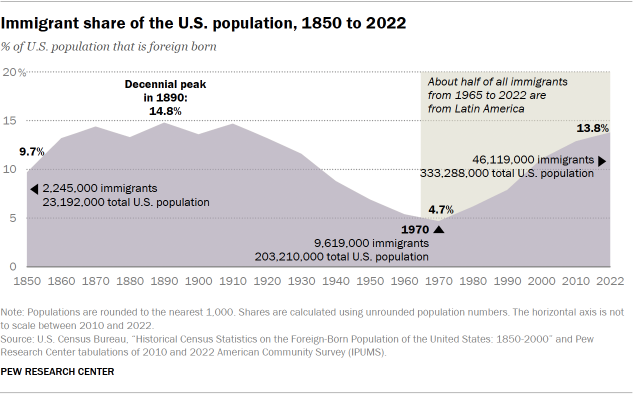
In 2022, the number of immigrants living in the U.S. reached a high of 46.1 million, accounting for 13.8% of the population. (This includes both legal and unauthorized immigrants.)
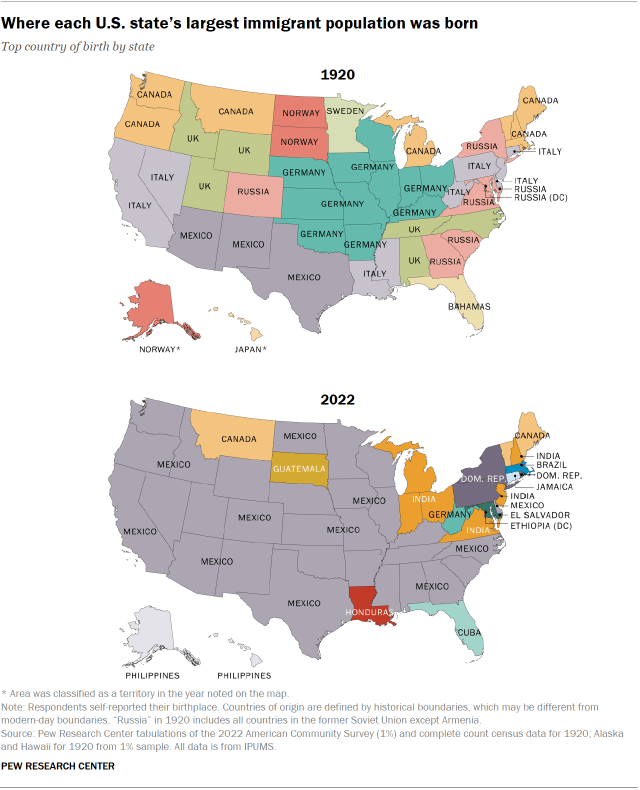
These immigrants trace their roots to virtually all countries around the world. The largest numbers hail from Mexico (10.6 million) and India (2.8 million). That’s different from a century ago: In 1920, the largest immigrant populations were from Germany and Italy.
Pew Research Center conducted this analysis to explore how immigration patterns have changed throughout the United States and by state over time.
The maps and data in this analysis are based on Center tabulations of Census Bureau microdata from IPUMS USA. The maps show the largest country of birth for immigrants in each state or territory from 1850 to 2022. The tabulations agree as closely as possible with published Census Bureau data on the national and state foreign-born populations and other national data on the country of birth of immigrants.
Data: For the 1850-1880 and 1900-1940 censuses, the tabulations use complete count census data, which has one record for each person counted in the census. The census data comes from 1% samples for 1950 and 1970 (form 1 for 1970). For the 1960 and 1980-2000 censuses, it comes from 5% samples. For 2010 and 2022, we use the 1% sample from the American Community Survey (ACS).
States and territories: Before 1960, some censuses included data for territories that would later become states. When available, we show data for these areas and designate the territorial status in the maps with an asterisk (*). Prior to 1959, Alaska and Hawaii were not routinely represented in IPUMS datasets used in this analysis. However, IPUMS samples that include these two areas in 1900-1920 (1% samples) and 1930 (5% sample) provide data for the maps.
Immigrant population: The immigrant or foreign-born population consists of people born outside the United States or its territories who are not U.S. citizens at birth. In census data for 1970-2000 and ACS data for 2010-2022, there is a direct question on U.S. citizenship that defines the foreign-born population.
For the earlier censuses, we used several steps to define the immigrant and U.S.-born or native populations. First, people born in U.S. territories and outlying areas are considered part of the native population.
The territories defined as part of the native population are: Alaska (1870 and later); Hawaii, Puerto Rico, Guam and American Samoa (1900 and later); Philippines (1900-1940); Panama Canal Zone (1900-1970); U.S. Virgin Islands (1920 and later); Trust Territory of the Pacific (1950-1980); and Northern Mariana Islands (1950 and later).
Beginning with the 1890 census, people born outside the U.S. and its territories were considered U.S. citizens at birth if they had one or two American-born parents under certain conditions. The criteria have changed over time and do not appear to have been consistently applied in the early censuses. The IPUMS data has coded some of these cases directly. For other cases, we use the country of birth of each respondent’s mother and father (either as reported in the census or assigned by IPUMS) to determine whether the individual is foreign born.
Country of birth: Countries of birth in the tabulations generally reflect the countries and regions within countries (e.g., Alsace-Lorraine, Bavaria) recognized at the time the data was collected. This reflects the responses to the census and generally agrees with official publications from the censuses. The country boundaries are similar to modern ones but may differ slightly in some cases.
The groupings used for the countries in the census and ACS data are:
- United Kingdom: England, Scotland, Wales and Channel Islands in all years; Northern Ireland in 1930 and later.
- Germany: Various German states, East Germany and West Germany in all years; Alsace and Lorraine for 1870-1910.
- Austria: Austria and regions defined as Austria, including Austria-Hungary.
- Poland: Regions defined as Poland, Austrian Poland, German Poland, Russian Poland, Prussian Poland, Galicia, Pomerania, West Prussia and various other areas.
- Russia (1850-1920), USSR (1930-1990), USSR (former): These designations basically refer to the same area. It includes Russia plus the republics within the Soviet Union (e.g., Estonia, Belarus, Ukraine, Kazakhstan, Siberia). The exception is Armenia, which is treated as a separate country for 1920-1930.
- China: Mongolia and Taiwan for 1850-1940; Hong Kong and Macau for 2000-2022.
- Portugal: Azores, Madeira Islands and St. Miguel in all years; Cape Verde Islands through 1970.
- Korea: North and South Korea.
Various other countries and regions are grouped together, but none are the top origin countries for states or in the top five origin countries nationally.
Immigrant populations by state
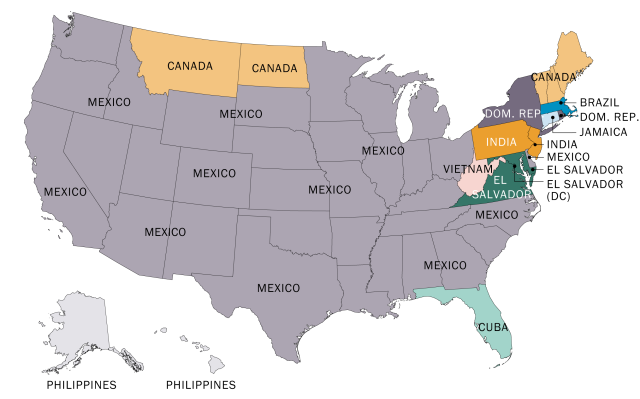
The share of immigrants varies widely among states, from 2% in West Virginia to 27% in California. In 2022, Mexican immigrants were the largest group in 29 states, while Indian immigrants were the largest group in six states.
Mirroring the national trend, the origins of immigrants living in each state have changed dramatically in the past century. In 1920, the largest immigrant groups in 29 states were born in Germany, Italy or Canada. And only six states had the same largest origin group in 2022 that they did in 1920: Arizona, New Mexico and Texas (all from Mexico) and Maine, Montana and Vermont (from Canada).
Why has the immigrant population changed over the years?
Reasons behind the changes in the U.S. immigrant population since 1965 include:
- A more equitable U.S. immigration law. The 1965 Immigration and Nationality Act opened up legal immigration from Asia and Latin America. The law it replaced had favored immigrants from Northern and Western Europe and mostly barred those from Asia.
- Unauthorized immigration. Unauthorized immigration to the U.S. began to grow in the 1970s, which made the total number of immigrants go up. Most of those who came before 1982 acquired legal status after the passage of the 1986 Immigration Reform and Control Act. However, unauthorized immigrants continued to come in large numbers.
- Further changes in U.S. immigration law. A revision to the 1965 act in 1990 allowed more legal immigrants to enter the U.S. and provided alternative ways for people to immigrate, increasing the diversity of origins.
Where immigrants have settled in the U.S. over time
1840-1889
The first large wave of immigration to the U.S. began in the 1840s and lasted until 1889. During this time, more than 14 million immigrants came to the country. Most arrived from Northern or Western Europe; Germany, Ireland and the United Kingdom alone accounted for 70% of the new arrivals.
1850
Top five foreign-born populations by country of origin (in millions)
Total U.S. population 23.2 million
Total foreign born 2.2 million
Percentage foreign born 9.7%
Note: Populations rounded to nearest 10,000. Shares and ranks based on unrounded numbers. Germany includes East and West Germany (1980-1990), German states coded by IPUMS (1850-1940). Alsace and Lorraine are part of Germany for 1870-1910 and France in other years. United Kingdom (UK) includes England, Scotland, Wales and Channel Islands in all years and Northern Ireland in 1930 and later. China includes Mongolia and Taiwan for 1850-1940; Hong Kong and Macau for 2000 and later. Poland includes areas designated as Poland by IPUMS (1850-1940) including “Austrian,” “German,” “Prussian” and “Russian” Poland. The term “Russia” is used for 1850-1920, “USSR” for 1930-1990 and “USSR (former)” for 2000 and later. These areas encompass all former republics of the USSR including Baltic states in all years. The only exception is Armenia which is coded separately in 1930-1940. Various other areas have been grouped together but do not appear in the top five countries for the U.S.
Source: U.S. Census Bureau, “Historical Census Statistics on the Foreign-Born Population of the United States: 1850-2000”; Pew Research Center tabulations of complete count census data for 1850-1940; census samples for 1950 (1%), 1960, 1980-2000 (5%) and 1970 (1% form 1); 2010 and 2022 American Community Survey (1%). Alaska and Hawaii from samples for 1900-1920 (1%) and 1930 (5%). All data from IPUMS.
1860
Top five foreign-born populations by country of origin (in millions)
Total U.S. population 31.4 million
Total foreign born 4.1 million
Percentage foreign born 13.2%
Note: Populations rounded to nearest 10,000. Shares and ranks based on unrounded numbers. Germany includes East and West Germany (1980-1990), German states coded by IPUMS (1850-1940). Alsace and Lorraine are part of Germany for 1870-1910 and France in other years. United Kingdom (UK) includes England, Scotland, Wales and Channel Islands in all years and Northern Ireland in 1930 and later. China includes Mongolia and Taiwan for 1850-1940; Hong Kong and Macau for 2000 and later. Poland includes areas designated as Poland by IPUMS (1850-1940) including “Austrian,” “German,” “Prussian” and “Russian” Poland. The term “Russia” is used for 1850-1920, “USSR” for 1930-1990 and “USSR (former)” for 2000 and later. These areas encompass all former republics of the USSR including Baltic states in all years. The only exception is Armenia which is coded separately in 1930-1940. Various other areas have been grouped together but do not appear in the top five countries for the U.S.
Source: U.S. Census Bureau, “Historical Census Statistics on the Foreign-Born Population of the United States: 1850-2000”; Pew Research Center tabulations of complete count census data for 1850-1940; census samples for 1950 (1%), 1960, 1980-2000 (5%) and 1970 (1% form 1); 2010 and 2022 American Community Survey (1%). Alaska and Hawaii from samples for 1900-1920 (1%) and 1930 (5%). All data from IPUMS.
1870
Top five foreign-born populations by country of origin (in millions)
Total U.S. population 38.6 million
Total foreign born 5.6 million
Percentage foreign born 14.4%
Note: Populations rounded to nearest 10,000. Shares and ranks based on unrounded numbers. Germany includes East and West Germany (1980-1990), German states coded by IPUMS (1850-1940). Alsace and Lorraine are part of Germany for 1870-1910 and France in other years. United Kingdom (UK) includes England, Scotland, Wales and Channel Islands in all years and Northern Ireland in 1930 and later. China includes Mongolia and Taiwan for 1850-1940; Hong Kong and Macau for 2000 and later. Poland includes areas designated as Poland by IPUMS (1850-1940) including “Austrian,” “German,” “Prussian” and “Russian” Poland. The term “Russia” is used for 1850-1920, “USSR” for 1930-1990 and “USSR (former)” for 2000 and later. These areas encompass all former republics of the USSR including Baltic states in all years. The only exception is Armenia which is coded separately in 1930-1940. Various other areas have been grouped together but do not appear in the top five countries for the U.S.
Source: U.S. Census Bureau, “Historical Census Statistics on the Foreign-Born Population of the United States: 1850-2000”; Pew Research Center tabulations of complete count census data for 1850-1940; census samples for 1950 (1%), 1960, 1980-2000 (5%) and 1970 (1% form 1); 2010 and 2022 American Community Survey (1%). Alaska and Hawaii from samples for 1900-1920 (1%) and 1930 (5%). All data from IPUMS.
1880
Top five foreign-born populations by country of origin (in millions)
Total U.S. population 50.2 million
Total foreign born 6.7 million
Percentage foreign born 13.3%
Note: Populations rounded to nearest 10,000. Shares and ranks based on unrounded numbers. Germany includes East and West Germany (1980-1990), German states coded by IPUMS (1850-1940). Alsace and Lorraine are part of Germany for 1870-1910 and France in other years. United Kingdom (UK) includes England, Scotland, Wales and Channel Islands in all years and Northern Ireland in 1930 and later. China includes Mongolia and Taiwan for 1850-1940; Hong Kong and Macau for 2000 and later. Poland includes areas designated as Poland by IPUMS (1850-1940) including “Austrian,” “German,” “Prussian” and “Russian” Poland. The term “Russia” is used for 1850-1920, “USSR” for 1930-1990 and “USSR (former)” for 2000 and later. These areas encompass all former republics of the USSR including Baltic states in all years. The only exception is Armenia which is coded separately in 1930-1940. Various other areas have been grouped together but do not appear in the top five countries for the U.S.
Source: U.S. Census Bureau, “Historical Census Statistics on the Foreign-Born Population of the United States: 1850-2000”; Pew Research Center tabulations of complete count census data for 1850-1940; census samples for 1950 (1%), 1960, 1980-2000 (5%) and 1970 (1% form 1); 2010 and 2022 American Community Survey (1%). Alaska and Hawaii from samples for 1900-1920 (1%) and 1930 (5%). All data from IPUMS.
1890
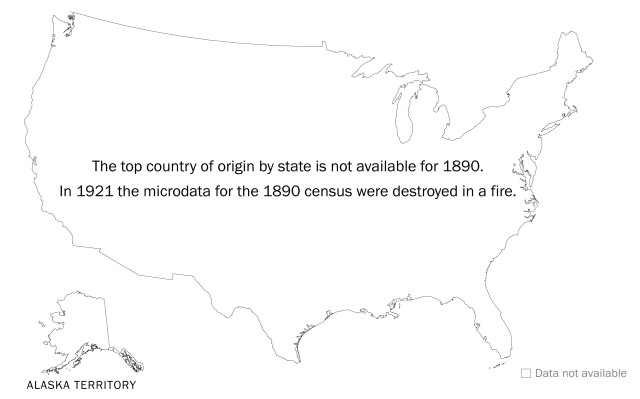
Top five foreign-born populations by country of origin (in millions)
Total U.S. population 62.6 million
Total foreign born 9.3 million
Percentage foreign born 14.8%
Note: Populations rounded to nearest 10,000. Shares and ranks based on unrounded numbers. Germany includes East and West Germany (1980-1990), German states coded by IPUMS (1850-1940). Alsace and Lorraine are part of Germany for 1870-1910 and France in other years. United Kingdom (UK) includes England, Scotland, Wales and Channel Islands in all years and Northern Ireland in 1930 and later. China includes Mongolia and Taiwan for 1850-1940; Hong Kong and Macau for 2000 and later. Poland includes areas designated as Poland by IPUMS (1850-1940) including “Austrian,” “German,” “Prussian” and “Russian” Poland. The term “Russia” is used for 1850-1920, “USSR” for 1930-1990 and “USSR (former)” for 2000 and later. These areas encompass all former republics of the USSR including Baltic states in all years. The only exception is Armenia which is coded separately in 1930-1940. Various other areas have been grouped together but do not appear in the top five countries for the U.S.
Source: U.S. Census Bureau, “Historical Census Statistics on the Foreign-Born Population of the United States: 1850-2000”; Pew Research Center tabulations of complete count census data for 1850-1940; census samples for 1950 (1%), 1960, 1980-2000 (5%) and 1970 (1% form 1); 2010 and 2022 American Community Survey (1%). Alaska and Hawaii from samples for 1900-1920 (1%) and 1930 (5%). All data from IPUMS.
1900
Top five foreign-born populations by country of origin (in millions)
Total U.S. population 76.0 million
Total foreign born 10.3 million
Percentage foreign born 13.6%
Note: Populations rounded to nearest 10,000. Shares and ranks based on unrounded numbers. Germany includes East and West Germany (1980-1990), German states coded by IPUMS (1850-1940). Alsace and Lorraine are part of Germany for 1870-1910 and France in other years. United Kingdom (UK) includes England, Scotland, Wales and Channel Islands in all years and Northern Ireland in 1930 and later. China includes Mongolia and Taiwan for 1850-1940; Hong Kong and Macau for 2000 and later. Poland includes areas designated as Poland by IPUMS (1850-1940) including “Austrian,” “German,” “Prussian” and “Russian” Poland. The term “Russia” is used for 1850-1920, “USSR” for 1930-1990 and “USSR (former)” for 2000 and later. These areas encompass all former republics of the USSR including Baltic states in all years. The only exception is Armenia which is coded separately in 1930-1940. Various other areas have been grouped together but do not appear in the top five countries for the U.S.
Source: U.S. Census Bureau, “Historical Census Statistics on the Foreign-Born Population of the United States: 1850-2000”; Pew Research Center tabulations of complete count census data for 1850-1940; census samples for 1950 (1%), 1960, 1980-2000 (5%) and 1970 (1% form 1); 2010 and 2022 American Community Survey (1%). Alaska and Hawaii from samples for 1900-1920 (1%) and 1930 (5%). All data from IPUMS.
1910
Top five foreign-born populations by country of origin (in millions)
Total U.S. population 92.0 million
Total foreign born 13.5 million
Percentage foreign born 14.7%
Note: Populations rounded to nearest 10,000. Shares and ranks based on unrounded numbers. Germany includes East and West Germany (1980-1990), German states coded by IPUMS (1850-1940). Alsace and Lorraine are part of Germany for 1870-1910 and France in other years. United Kingdom (UK) includes England, Scotland, Wales and Channel Islands in all years and Northern Ireland in 1930 and later. China includes Mongolia and Taiwan for 1850-1940; Hong Kong and Macau for 2000 and later. Poland includes areas designated as Poland by IPUMS (1850-1940) including “Austrian,” “German,” “Prussian” and “Russian” Poland. The term “Russia” is used for 1850-1920, “USSR” for 1930-1990 and “USSR (former)” for 2000 and later. These areas encompass all former republics of the USSR including Baltic states in all years. The only exception is Armenia which is coded separately in 1930-1940. Various other areas have been grouped together but do not appear in the top five countries for the U.S.
Source: U.S. Census Bureau, “Historical Census Statistics on the Foreign-Born Population of the United States: 1850-2000”; Pew Research Center tabulations of complete count census data for 1850-1940; census samples for 1950 (1%), 1960, 1980-2000 (5%) and 1970 (1% form 1); 2010 and 2022 American Community Survey (1%). Alaska and Hawaii from samples for 1900-1920 (1%) and 1930 (5%). All data from IPUMS.
1920
Top five foreign-born populations by country of origin (in millions)
Total U.S. population 105.7 million
Total foreign born 13.9 million
Percentage foreign born 13.2%
Note: Populations rounded to nearest 10,000. Shares and ranks based on unrounded numbers. Germany includes East and West Germany (1980-1990), German states coded by IPUMS (1850-1940). Alsace and Lorraine are part of Germany for 1870-1910 and France in other years. United Kingdom (UK) includes England, Scotland, Wales and Channel Islands in all years and Northern Ireland in 1930 and later. China includes Mongolia and Taiwan for 1850-1940; Hong Kong and Macau for 2000 and later. Poland includes areas designated as Poland by IPUMS (1850-1940) including “Austrian,” “German,” “Prussian” and “Russian” Poland. The term “Russia” is used for 1850-1920, “USSR” for 1930-1990 and “USSR (former)” for 2000 and later. These areas encompass all former republics of the USSR including Baltic states in all years. The only exception is Armenia which is coded separately in 1930-1940. Various other areas have been grouped together but do not appear in the top five countries for the U.S.
Source: U.S. Census Bureau, “Historical Census Statistics on the Foreign-Born Population of the United States: 1850-2000”; Pew Research Center tabulations of complete count census data for 1850-1940; census samples for 1950 (1%), 1960, 1980-2000 (5%) and 1970 (1% form 1); 2010 and 2022 American Community Survey (1%). Alaska and Hawaii from samples for 1900-1920 (1%) and 1930 (5%). All data from IPUMS.
1930

Top five foreign-born populations by country of origin (in millions)
Total U.S. population 122.8 million
Total foreign born 14.2 million
Percentage foreign born 11.6%
Note: Populations rounded to nearest 10,000. Shares and ranks based on unrounded numbers. Germany includes East and West Germany (1980-1990), German states coded by IPUMS (1850-1940). Alsace and Lorraine are part of Germany for 1870-1910 and France in other years. United Kingdom (UK) includes England, Scotland, Wales and Channel Islands in all years and Northern Ireland in 1930 and later. China includes Mongolia and Taiwan for 1850-1940; Hong Kong and Macau for 2000 and later. Poland includes areas designated as Poland by IPUMS (1850-1940) including “Austrian,” “German,” “Prussian” and “Russian” Poland. The term “Russia” is used for 1850-1920, “USSR” for 1930-1990 and “USSR (former)” for 2000 and later. These areas encompass all former republics of the USSR including Baltic states in all years. The only exception is Armenia which is coded separately in 1930-1940. Various other areas have been grouped together but do not appear in the top five countries for the U.S.
Source: U.S. Census Bureau, “Historical Census Statistics on the Foreign-Born Population of the United States: 1850-2000”; Pew Research Center tabulations of complete count census data for 1850-1940; census samples for 1950 (1%), 1960, 1980-2000 (5%) and 1970 (1% form 1); 2010 and 2022 American Community Survey (1%). Alaska and Hawaii from samples for 1900-1920 (1%) and 1930 (5%). All data from IPUMS.
1940
Top five foreign-born populations by country of origin (in millions)
Total U.S. population 131.7 million
Total foreign born 11.6 million
Percentage foreign born 8.8%
Note: Populations rounded to nearest 10,000. Shares and ranks based on unrounded numbers. Germany includes East and West Germany (1980-1990), German states coded by IPUMS (1850-1940). Alsace and Lorraine are part of Germany for 1870-1910 and France in other years. United Kingdom (UK) includes England, Scotland, Wales and Channel Islands in all years and Northern Ireland in 1930 and later. China includes Mongolia and Taiwan for 1850-1940; Hong Kong and Macau for 2000 and later. Poland includes areas designated as Poland by IPUMS (1850-1940) including “Austrian,” “German,” “Prussian” and “Russian” Poland. The term “Russia” is used for 1850-1920, “USSR” for 1930-1990 and “USSR (former)” for 2000 and later. These areas encompass all former republics of the USSR including Baltic states in all years. The only exception is Armenia which is coded separately in 1930-1940. Various other areas have been grouped together but do not appear in the top five countries for the U.S.
Source: U.S. Census Bureau, “Historical Census Statistics on the Foreign-Born Population of the United States: 1850-2000”; Pew Research Center tabulations of complete count census data for 1850-1940; census samples for 1950 (1%), 1960, 1980-2000 (5%) and 1970 (1% form 1); 2010 and 2022 American Community Survey (1%). Alaska and Hawaii from samples for 1900-1920 (1%) and 1930 (5%). All data from IPUMS.
1950
Top five foreign-born populations by country of origin (in millions)
Total U.S. population 150.2 million
Total foreign born 10.3 million
Percentage foreign born 6.9%
Note: Populations rounded to nearest 10,000. Shares and ranks based on unrounded numbers. Germany includes East and West Germany (1980-1990), German states coded by IPUMS (1850-1940). Alsace and Lorraine are part of Germany for 1870-1910 and France in other years. United Kingdom (UK) includes England, Scotland, Wales and Channel Islands in all years and Northern Ireland in 1930 and later. China includes Mongolia and Taiwan for 1850-1940; Hong Kong and Macau for 2000 and later. Poland includes areas designated as Poland by IPUMS (1850-1940) including “Austrian,” “German,” “Prussian” and “Russian” Poland. The term “Russia” is used for 1850-1920, “USSR” for 1930-1990 and “USSR (former)” for 2000 and later. These areas encompass all former republics of the USSR including Baltic states in all years. The only exception is Armenia which is coded separately in 1930-1940. Various other areas have been grouped together but do not appear in the top five countries for the U.S.
Source: U.S. Census Bureau, “Historical Census Statistics on the Foreign-Born Population of the United States: 1850-2000”; Pew Research Center tabulations of complete count census data for 1850-1940; census samples for 1950 (1%), 1960, 1980-2000 (5%) and 1970 (1% form 1); 2010 and 2022 American Community Survey (1%). Alaska and Hawaii from samples for 1900-1920 (1%) and 1930 (5%). All data from IPUMS.
1960
Top five foreign-born populations by country of origin (in millions)
Total U.S. population 179.3 million
Total foreign born 9.7 million
Percentage foreign born 5.4%
Note: Populations rounded to nearest 10,000. Shares and ranks based on unrounded numbers. Germany includes East and West Germany (1980-1990), German states coded by IPUMS (1850-1940). Alsace and Lorraine are part of Germany for 1870-1910 and France in other years. United Kingdom (UK) includes England, Scotland, Wales and Channel Islands in all years and Northern Ireland in 1930 and later. China includes Mongolia and Taiwan for 1850-1940; Hong Kong and Macau for 2000 and later. Poland includes areas designated as Poland by IPUMS (1850-1940) including “Austrian,” “German,” “Prussian” and “Russian” Poland. The term “Russia” is used for 1850-1920, “USSR” for 1930-1990 and “USSR (former)” for 2000 and later. These areas encompass all former republics of the USSR including Baltic states in all years. The only exception is Armenia which is coded separately in 1930-1940. Various other areas have been grouped together but do not appear in the top five countries for the U.S.
Source: U.S. Census Bureau, “Historical Census Statistics on the Foreign-Born Population of the United States: 1850-2000”; Pew Research Center tabulations of complete count census data for 1850-1940; census samples for 1950 (1%), 1960, 1980-2000 (5%) and 1970 (1% form 1); 2010 and 2022 American Community Survey (1%). Alaska and Hawaii from samples for 1900-1920 (1%) and 1930 (5%). All data from IPUMS.
1970
Top five foreign-born populations by country of origin (in millions)
Total U.S. population 203.2 million
Total foreign born 9.6 million
Percentage foreign born 4.7%
Note: Populations rounded to nearest 10,000. Shares and ranks based on unrounded numbers. Germany includes East and West Germany (1980-1990), German states coded by IPUMS (1850-1940). Alsace and Lorraine are part of Germany for 1870-1910 and France in other years. United Kingdom (UK) includes England, Scotland, Wales and Channel Islands in all years and Northern Ireland in 1930 and later. China includes Mongolia and Taiwan for 1850-1940; Hong Kong and Macau for 2000 and later. Poland includes areas designated as Poland by IPUMS (1850-1940) including “Austrian,” “German,” “Prussian” and “Russian” Poland. The term “Russia” is used for 1850-1920, “USSR” for 1930-1990 and “USSR (former)” for 2000 and later. These areas encompass all former republics of the USSR including Baltic states in all years. The only exception is Armenia which is coded separately in 1930-1940. Various other areas have been grouped together but do not appear in the top five countries for the U.S.
Source: U.S. Census Bureau, “Historical Census Statistics on the Foreign-Born Population of the United States: 1850-2000”; Pew Research Center tabulations of complete count census data for 1850-1940; census samples for 1950 (1%), 1960, 1980-2000 (5%) and 1970 (1% form 1); 2010 and 2022 American Community Survey (1%). Alaska and Hawaii from samples for 1900-1920 (1%) and 1930 (5%). All data from IPUMS.
1980
Top five foreign-born populations by country of origin (in millions)
Total U.S. population 226.5 million
Total foreign born 14.1 million
Percentage foreign born 6.2%
Note: Populations rounded to nearest 10,000. Shares and ranks based on unrounded numbers. Germany includes East and West Germany (1980-1990), German states coded by IPUMS (1850-1940). Alsace and Lorraine are part of Germany for 1870-1910 and France in other years. United Kingdom (UK) includes England, Scotland, Wales and Channel Islands in all years and Northern Ireland in 1930 and later. China includes Mongolia and Taiwan for 1850-1940; Hong Kong and Macau for 2000 and later. Poland includes areas designated as Poland by IPUMS (1850-1940) including “Austrian,” “German,” “Prussian” and “Russian” Poland. The term “Russia” is used for 1850-1920, “USSR” for 1930-1990 and “USSR (former)” for 2000 and later. These areas encompass all former republics of the USSR including Baltic states in all years. The only exception is Armenia which is coded separately in 1930-1940. Various other areas have been grouped together but do not appear in the top five countries for the U.S.
Source: U.S. Census Bureau, “Historical Census Statistics on the Foreign-Born Population of the United States: 1850-2000”; Pew Research Center tabulations of complete count census data for 1850-1940; census samples for 1950 (1%), 1960, 1980-2000 (5%) and 1970 (1% form 1); 2010 and 2022 American Community Survey (1%). Alaska and Hawaii from samples for 1900-1920 (1%) and 1930 (5%). All data from IPUMS.
1990

Top five foreign-born populations by country of origin (in millions)
Total U.S. population 248.7 million
Total foreign born 19.8 million
Percentage foreign born 7.9%
Note: Populations rounded to nearest 10,000. Shares and ranks based on unrounded numbers. Germany includes East and West Germany (1980-1990), German states coded by IPUMS (1850-1940). Alsace and Lorraine are part of Germany for 1870-1910 and France in other years. United Kingdom (UK) includes England, Scotland, Wales and Channel Islands in all years and Northern Ireland in 1930 and later. China includes Mongolia and Taiwan for 1850-1940; Hong Kong and Macau for 2000 and later. Poland includes areas designated as Poland by IPUMS (1850-1940) including “Austrian,” “German,” “Prussian” and “Russian” Poland. The term “Russia” is used for 1850-1920, “USSR” for 1930-1990 and “USSR (former)” for 2000 and later. These areas encompass all former republics of the USSR including Baltic states in all years. The only exception is Armenia which is coded separately in 1930-1940. Various other areas have been grouped together but do not appear in the top five countries for the U.S.
Source: U.S. Census Bureau, “Historical Census Statistics on the Foreign-Born Population of the United States: 1850-2000”; Pew Research Center tabulations of complete count census data for 1850-1940; census samples for 1950 (1%), 1960, 1980-2000 (5%) and 1970 (1% form 1); 2010 and 2022 American Community Survey (1%). Alaska and Hawaii from samples for 1900-1920 (1%) and 1930 (5%). All data from IPUMS.
2000
Top five foreign-born populations by country of origin (in millions)
Total U.S. population 281.4 million
Total foreign born 31.1 million
Percentage foreign born 11.1%
Note: Populations rounded to nearest 10,000. Shares and ranks based on unrounded numbers. Germany includes East and West Germany (1980-1990), German states coded by IPUMS (1850-1940). Alsace and Lorraine are part of Germany for 1870-1910 and France in other years. United Kingdom (UK) includes England, Scotland, Wales and Channel Islands in all years and Northern Ireland in 1930 and later. China includes Mongolia and Taiwan for 1850-1940; Hong Kong and Macau for 2000 and later. Poland includes areas designated as Poland by IPUMS (1850-1940) including “Austrian,” “German,” “Prussian” and “Russian” Poland. The term “Russia” is used for 1850-1920, “USSR” for 1930-1990 and “USSR (former)” for 2000 and later. These areas encompass all former republics of the USSR including Baltic states in all years. The only exception is Armenia which is coded separately in 1930-1940. Various other areas have been grouped together but do not appear in the top five countries for the U.S.
Source: U.S. Census Bureau, “Historical Census Statistics on the Foreign-Born Population of the United States: 1850-2000”; Pew Research Center tabulations of complete count census data for 1850-1940; census samples for 1950 (1%), 1960, 1980-2000 (5%) and 1970 (1% form 1); 2010 and 2022 American Community Survey (1%). Alaska and Hawaii from samples for 1900-1920 (1%) and 1930 (5%). All data from IPUMS.
2010
Top five foreign-born populations by country of origin (in millions)
Total U.S. population 309.4 million
Total foreign born 40.0 million
Percentage foreign born 12.9%
Note: Populations rounded to nearest 10,000. Shares and ranks based on unrounded numbers. Germany includes East and West Germany (1980-1990), German states coded by IPUMS (1850-1940). Alsace and Lorraine are part of Germany for 1870-1910 and France in other years. United Kingdom (UK) includes England, Scotland, Wales and Channel Islands in all years and Northern Ireland in 1930 and later. China includes Mongolia and Taiwan for 1850-1940; Hong Kong and Macau for 2000 and later. Poland includes areas designated as Poland by IPUMS (1850-1940) including “Austrian,” “German,” “Prussian” and “Russian” Poland. The term “Russia” is used for 1850-1920, “USSR” for 1930-1990 and “USSR (former)” for 2000 and later. These areas encompass all former republics of the USSR including Baltic states in all years. The only exception is Armenia which is coded separately in 1930-1940. Various other areas have been grouped together but do not appear in the top five countries for the U.S.
Source: U.S. Census Bureau, “Historical Census Statistics on the Foreign-Born Population of the United States: 1850-2000”; Pew Research Center tabulations of complete count census data for 1850-1940; census samples for 1950 (1%), 1960, 1980-2000 (5%) and 1970 (1% form 1); 2010 and 2022 American Community Survey (1%). Alaska and Hawaii from samples for 1900-1920 (1%) and 1930 (5%). All data from IPUMS.
2022
Top five foreign-born populations by country of origin (in millions)
Total U.S. population 333.3 million
Total foreign born 46.1 million
Percentage foreign born 13.8%
Note: Populations rounded to nearest 10,000. Shares and ranks based on unrounded numbers. Germany includes East and West Germany (1980-1990), German states coded by IPUMS (1850-1940). Alsace and Lorraine are part of Germany for 1870-1910 and France in other years. United Kingdom (UK) includes England, Scotland, Wales and Channel Islands in all years and Northern Ireland in 1930 and later. China includes Mongolia and Taiwan for 1850-1940; Hong Kong and Macau for 2000 and later. Poland includes areas designated as Poland by IPUMS (1850-1940) including “Austrian,” “German,” “Prussian” and “Russian” Poland. The term “Russia” is used for 1850-1920, “USSR” for 1930-1990 and “USSR (former)” for 2000 and later. These areas encompass all former republics of the USSR including Baltic states in all years. The only exception is Armenia which is coded separately in 1930-1940. Various other areas have been grouped together but do not appear in the top five countries for the U.S.
Source: U.S. Census Bureau, “Historical Census Statistics on the Foreign-Born Population of the United States: 1850-2000”; Pew Research Center tabulations of complete count census data for 1850-1940; census samples for 1950 (1%), 1960, 1980-2000 (5%) and 1970 (1% form 1); 2010 and 2022 American Community Survey (1%). Alaska and Hawaii from samples for 1900-1920 (1%) and 1930 (5%). All data from IPUMS.
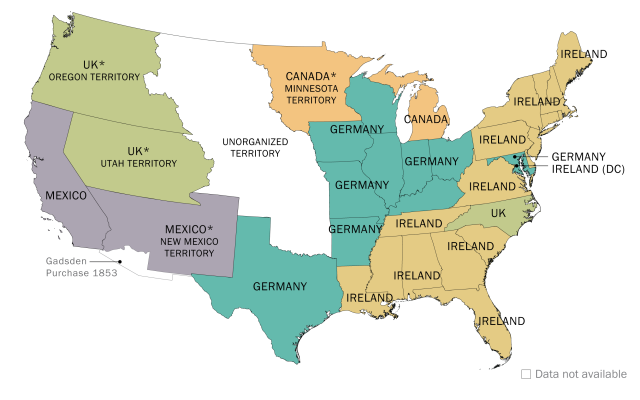
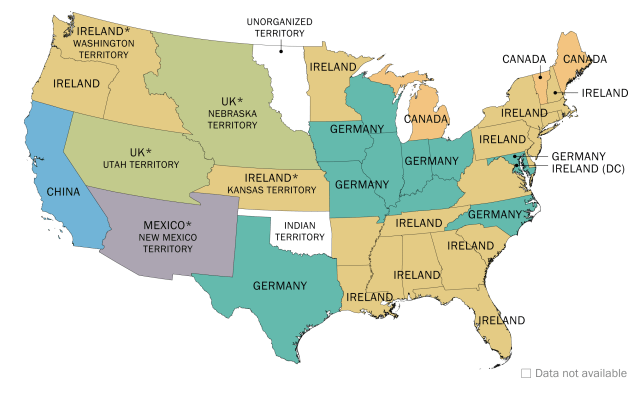
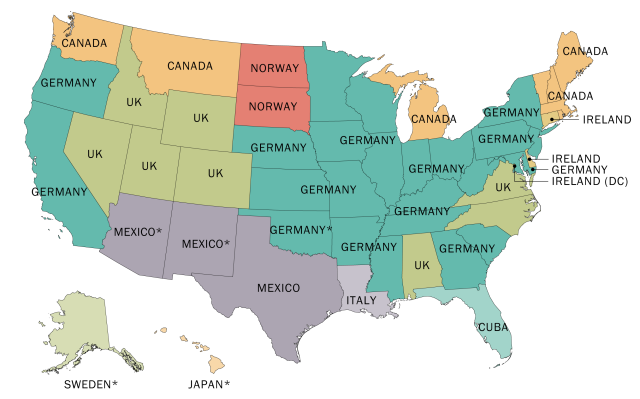
From 1850 to 1880, Germany and Ireland were the largest immigrant origin countries in most states and territories. In 1860, Ireland was the largest origin country in 22 of the nation’s 39 states and territories.
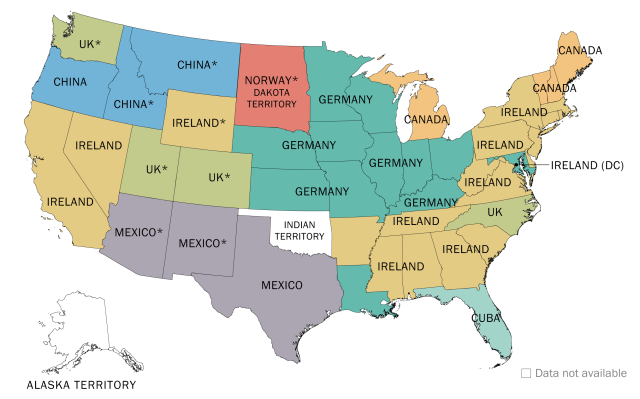
By 1880, Germany was the largest origin country in 16 states and territories. Chinese immigrants were the largest group in California, Nevada, Oregon, and the Idaho and Washington territories. Mexicans were the largest group in Texas and the New Mexico and Arizona territories.
1890-1919
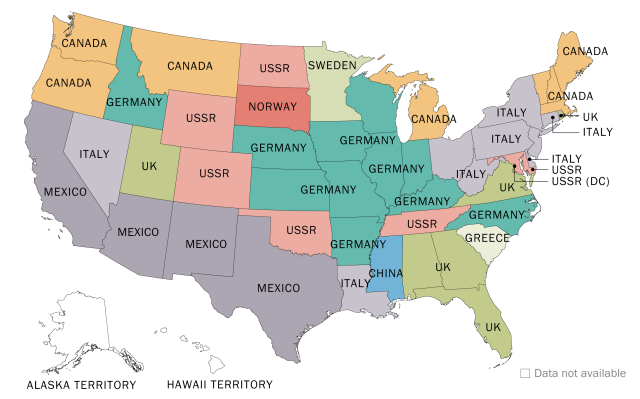
The next wave of immigration to the U.S. lasted from 1890 to 1919, when more than 18 million immigrants arrived. By then, over 60% came from Eastern and Southern Europe, with large numbers arriving from Italy, Austria-Hungary, Russia and Poland.
1920-1964
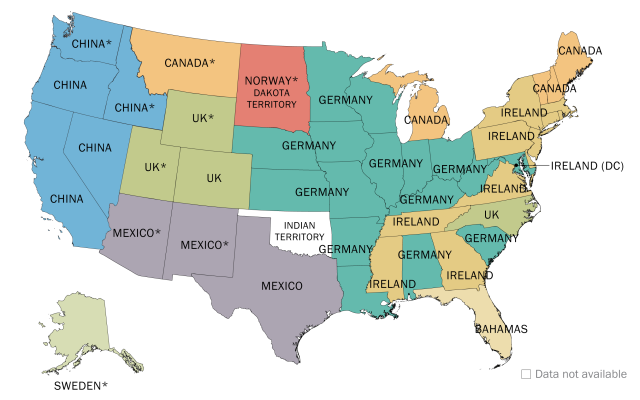
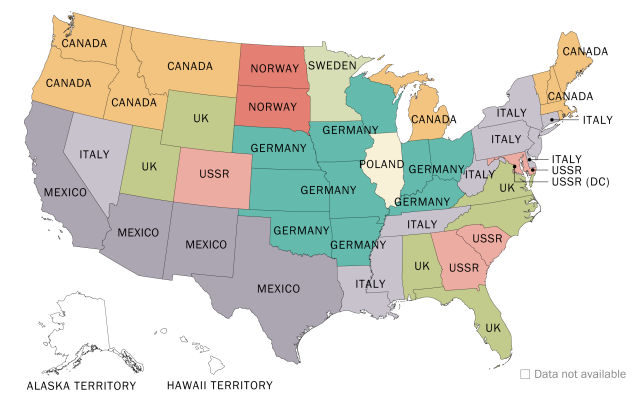
The number of new immigrants fell dramatically in the years between World War I and World War II (1919 to 1939). As a result, the largest immigrant groups in each state did not change much for the next few decades.
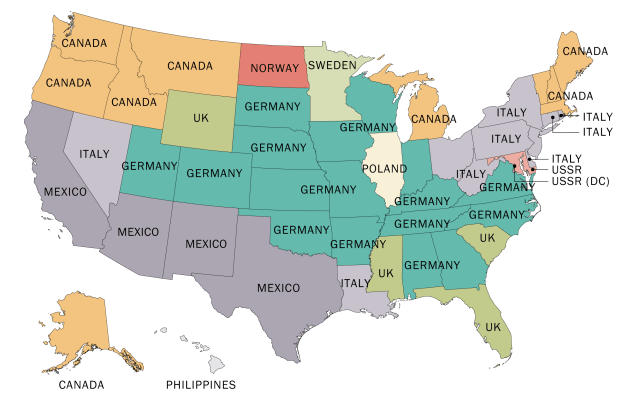
In 1920, German immigrants were the largest group in 11 states, down from 18 in 1910. Immigrants from Italy and Russia became the largest groups in a growing number of states. At their peaks, Italians were the largest group in 10 states in 1940 and 1960, and Russians were the biggest in seven states in 1920 and 1950.
By 1960, the largest number of immigrants in most states came from Germany (17 states), Italy (10) and Canada (10).
1965-2007
Another wave of immigration began in 1965. Most immigrants in this wave came from Latin America (49%) or Asia (27%). Mexico alone accounted for about 25% of these new immigrants. Large numbers also came from China, India, the Philippines, Central America and the Caribbean.
After 1990, the number of unauthorized immigrants in the U.S. started to grow quickly, from 3.5 million to 12.2 million in 2007. Most unauthorized immigrants in the U.S. at this time came from Mexico, which was also the largest source of legal immigrants.
These new legal and unauthorized arrivals led to major changes in states’ immigrant populations. Mexican immigrants became the largest group in an increasing number of states.
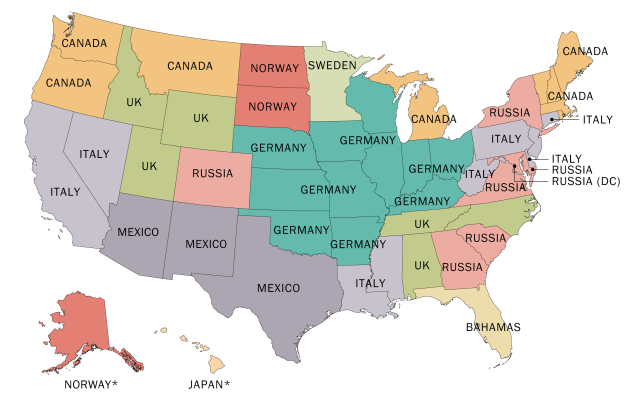
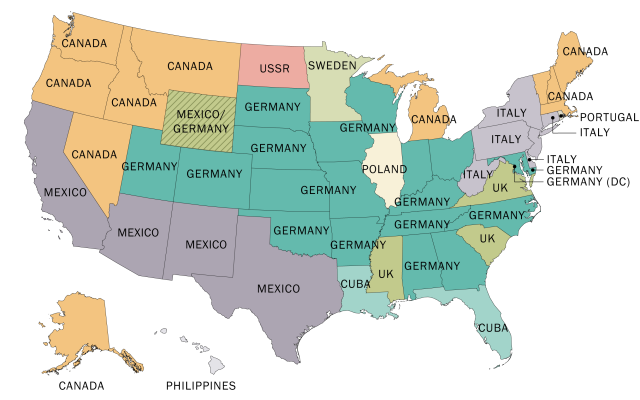
In 1980, Mexican immigrants were the largest group in 10 states, trailing German immigrants (19 states) and Canadian immigrants (11 states).
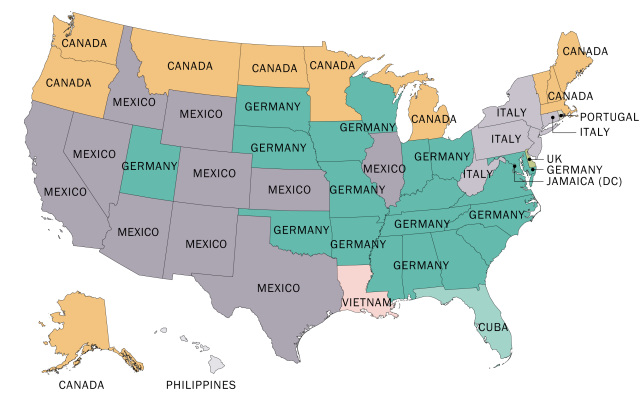
By 2000, Mexican immigrants were the largest group in 31 states, and Germans were no longer the largest immigrant group in any state. Immigrants from Cuba, El Salvador, the Dominican Republic, Vietnam, the Philippines and India were the largest groups in 11 states.
2008-today
The onset of the Great Recession led to changes in immigration patterns. Mexican immigration to the U.S. slowed dramatically after 2007. As a result, the Mexican immigrant population stopped growing. Though Mexico remained the largest source of U.S. immigrants, Mexicans’ share of the immigrant population fell from 29% in 2010 to 23% in 2022.
Meanwhile, immigration from Asia increased rapidly. In the 2010s, there were more new arrivals from Asia than from Latin America.
The unauthorized immigrant population declined from 12.2 million in 2007 to 10.2 million in 2019. Since then, though, the unauthorized immigrant population has grown again, reaching 11.0 million in 2022.
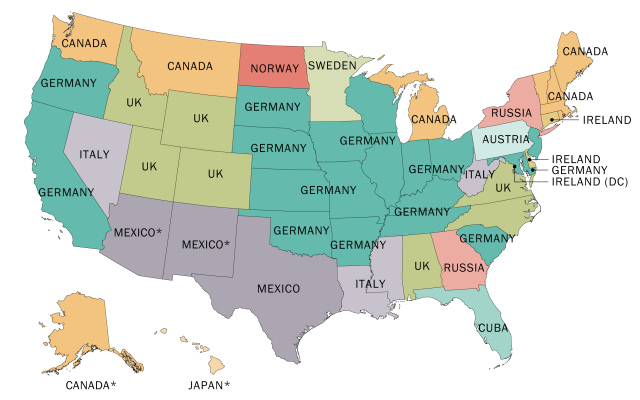
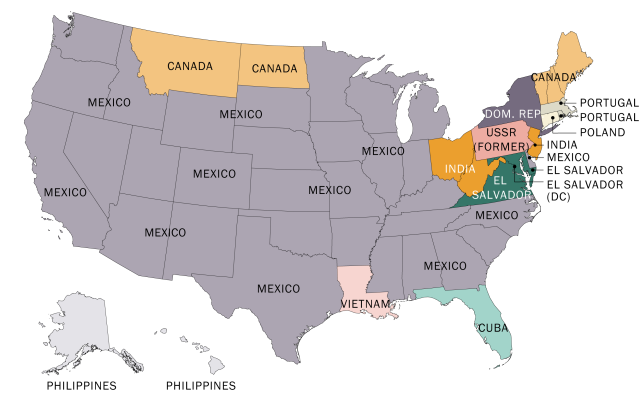
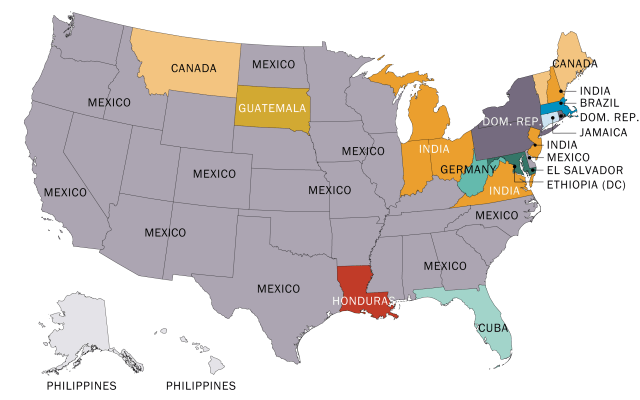
Mexico remained the largest country of birth for immigrants in 29 states in 2022, while India was the largest in six states. For the first time, the following origin groups made up the largest immigrant population in a state or district:
- Ethiopians in the District of Columbia
- Guatemalans in South Dakota
- Hondurans in Louisiana
Note: This is an update of a post originally published Oct. 7, 2015.
Where immigrants to the US come from, 1850 to today #immigrants #today

Source Link: https://www.pewresearch.org/short-reads/2024/07/22/how-the-origins-of-americas-immigrants-have-changed-since-1850/
The United States is the top destination in the world for people moving from one country to another. Over 70 million immigrants have arrived in the U.S. since 1965, according to a Pew Research Center analysis of Census Bureau data. About 18 million have come from Mexico, making up the largest wave of immigration from …
#WP12 – BLOGGER – WP12, immigrants, today